

Introduction
Google Sheets is a powerful and accessible tool for organizing and analyzing data. Whether you’re a business owner, a project manager, or a data analyst, it’s likely you’ve used Sheets for tracking, reporting, and presenting data. However, what if you could turn your Google Sheets into a dynamic and interactive dashboard, all while leveraging the power of Google Apps Script?
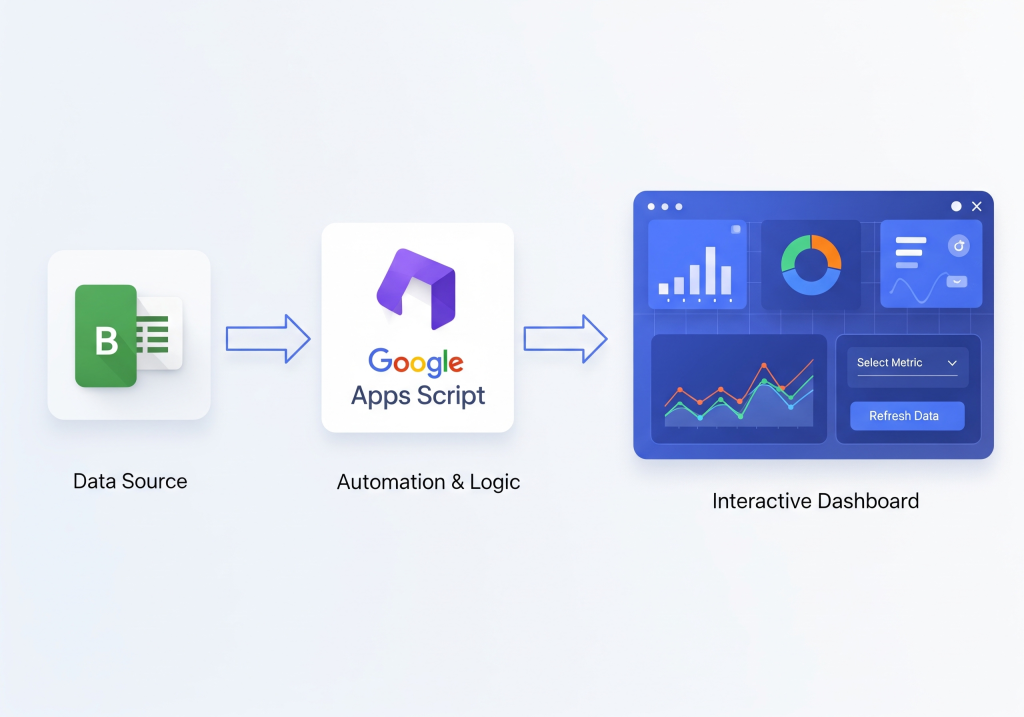
In this blog post, we’ll dive into how to create interactive dashboards within Google Sheets using Apps Script. We’ll go over the essential concepts, step-by-step instructions, and examples that will help you get started in creating dashboards that are not only visually appealing but also functional and dynamic.
Table of Contents
- What is Google Apps Script?
- Why Use Google Apps Script for Dashboards?
- Understanding Google Sheets as a Dashboard Tool
- Setting Up Your Google Sheet for a Dashboard
- Creating Interactive Components with Google Apps Script
- Adding Data Interactivity to Your Dashboard
- Customizing Your Dashboard with Google Apps Script
- Common Google Apps Script Functions for Dashboards
- Best Practices for Building Effective Dashboards
- Troubleshooting and Optimization
- Final Thoughts: Moving Forward with Google Apps Script
1. What is Google Apps Script?
Before we dive into building interactive dashboards, let’s first understand what Google Apps Script is.
Google Apps Script is a cloud-based scripting language for light-weight application development in the Google Workspace platform. It’s built on JavaScript, and it allows you to automate tasks, integrate with external APIs, and create custom functionality within Google Sheets, Docs, Gmail, and other Google Workspace applications.
With Apps Script, you can:
- Automate repetitive tasks
- Create custom menus and interfaces
- Manipulate Google Sheets data programmatically
- Integrate with external data sources and services
This makes Apps Script a great tool for customizing and enhancing Google Sheets, turning it from a static tool into an interactive data presentation platform.
2. Why Use Google Apps Script for Dashboards?
There are many reasons why you might want to use Google Apps Script to build a dashboard in Google Sheets. Here are just a few:
- Customization: You have full control over the functionality and look of your dashboard.
- Interactivity: With Apps Script, you can create buttons, dropdowns, and other interactive elements that allow users to manipulate the data dynamically.
- Automation: You can automate data imports, updates, and actions based on user inputs.
- Integration: Google Apps Script allows you to pull in data from external sources (like APIs or databases), making your dashboard more powerful and dynamic.
- Collaboration: Google Sheets is already a collaborative platform, and Apps Script allows multiple users to interact with the dashboard in real-time.
3. Understanding Google Sheets as a Dashboard Tool
Google Sheets can serve as a great tool for creating interactive dashboards, especially when paired with Google Apps Script. Here’s why:
- Data Organization: Sheets lets you store and manipulate large sets of data. It also allows for easy aggregation and analysis of data.
- Charts and Graphs: Google Sheets comes with a wide variety of built-in charts and graphs that you can use to visualize your data.
- Data Validation: Google Sheets supports data validation, which ensures users enter data in the correct format, further enhancing the interactivity of your dashboard.
A simple example of a dashboard could involve using data validation drop-downs to filter data across multiple sheets, generating real-time reports as a result.
4. Setting Up Your Google Sheet for a Dashboard
Before jumping into Apps Script, you’ll need to set up your Google Sheets file properly. Follow these steps to get started:
Step 1: Organize Your Data
For any dashboard, your data must be well-organized. Here’s how to structure it:
- Data Sheet: This sheet will store the raw data you will use in your dashboard.
- Dashboard Sheet: This is where your interactive charts, controls (like dropdowns), and other dashboard elements will go.
Step 2: Create Basic Charts
Google Sheets allows you to create charts from your data easily. Select the range of data you want to visualize, click on the Insert menu, and choose Chart. This will generate a chart that you can customize further based on the data.
You might want to create different types of charts based on the data, such as bar graphs, line charts, or pie charts.
5. Creating Interactive Components with Google Apps Script
Google Apps Script is the key to transforming your basic dashboard into an interactive tool. Let’s start by adding some interactive components:
Example 1: Dropdown Menu for Filtering Data
Let’s say you have a sales dataset with multiple products. You want the user to be able to select a product from a dropdown menu, and the dashboard will update to show only the data related to that product.
Here’s how to do it:
- Create the Dropdown:
- Go to your Dashboard Sheet.
- Select the cell where you want the dropdown menu.
- Click Data -> Data Validation.
- Choose List from a range and enter the range where your product names are stored.
- Write the Script to Filter Data:
Here’s a simple Apps Script code to handle this:
function filterDataByProduct() {
  var ss = SpreadsheetApp.getActiveSpreadsheet();
  var sheet = ss.getSheetByName('Dashboard');
  var product = sheet.getRange('B1').getValue();  // Dropdown value in cell B1

  var dataSheet = ss.getSheetByName('Data');
  var data = dataSheet.getDataRange().getValues();

  var filteredData = data.filter(function(row) {
    return row[1] === product;  // Assuming product name is in the second column
  });

  // Display the filtered data on the dashboard
  sheet.getRange('A3:B10').setValues(filteredData);  // Adjust the range as necessary
}
- Set up a Trigger:
- Go to Extensions -> Apps Script.
- In the Apps Script editor, click on the clock icon (Triggers).
- Set the trigger to run
filterDataByProductwhenever the value in the dropdown changes.
This setup allows the dashboard to update dynamically based on the selected product.
6. Adding Data Interactivity to Your Dashboard
Beyond dropdowns, you can create several other interactive components using Google Apps Script:
Example 2: Button to Refresh Data
Sometimes, you may want a button to refresh the data in your dashboard. Here’s how to create a button that, when clicked, updates the displayed data:
- Add a Button:
- Go to the Dashboard Sheet.
- Insert a shape (e.g., a rectangle) using Insert -> Drawing.
- After drawing the shape, click on the three dots in the top-right corner of the shape, then click Assign Script.
- Enter the name of the function you will create (e.g.,
refreshData).
- Create the Refresh Script:
function refreshData() {
  var ss = SpreadsheetApp.getActiveSpreadsheet();
  var dashboardSheet = ss.getSheetByName('Dashboard');

  // Example of refreshing data from a different sheet
  var dataSheet = ss.getSheetByName('Data');
  var data = dataSheet.getDataRange().getValues();

  // You can apply any data processing logic here

  // Update the dashboard with the latest data
  dashboardSheet.getRange('A3:B10').setValues(data);
}
7. Customizing Your Dashboard with Google Apps Script
To make your dashboard visually appealing, Google Apps Script allows you to apply formatting dynamically. For instance, you can change the background color, font styles, or even the border of a cell based on certain conditions.
Here’s an example of applying conditional formatting:
Example 3: Conditional Formatting for Sales
Let’s say you want to highlight cells in the sales column if the sales number is below a certain threshold.
function applyConditionalFormatting() {
  var ss = SpreadsheetApp.getActiveSpreadsheet();
  var sheet = ss.getSheetByName('Dashboard');
  var range = sheet.getRange('B3:B10');  // Adjust the range

  // Set the conditional format rule
  var rule = SpreadsheetApp.newConditionalFormatRule()
    .whenLessThan(1000)  // Threshold value
    .setBackgroundColor('#FF0000')  // Red color
    .setFontColor('#FFFFFF')  // White font color
    .setBold(true)
    .setRanges([range])
    .build();

  // Apply the rule to the range
  var rules = sheet.getConditionalFormatRules();
  rules.push(rule);
  sheet.setConditionalFormatRules(rules);
}
8. Common Google Apps Script Functions for Dashboards
Here are some commonly used Apps Script functions that you will find useful when building dashboards:
- getValue() / setValue(): Read and write individual cell values.
- getRange(): Get a specific range of cells.
- getDataRange(): Get the entire data range of a sheet.
- getValues() / setValues(): Get or set values for a range of cells.
- onEdit(): Trigger a function when a user edits a cell in the sheet.
- getUi(): Access the Google Sheets user interface to create custom dialogs and sidebars.
9. Best Practices for Building Effective Dashboards
When creating dashboards, it’s important to keep the following in mind:
- Simplicity: Avoid overloading the user with too many options. Keep it simple and intuitive.
- Visual Appeal: Use charts, graphs, and colors to make your data more digestible.
- Responsiveness: Ensure your dashboard updates in real-time based on user inputs.
- Consistency: Make sure the design elements (e.g., fonts, colors) are consistent across your dashboard.
- Testing: Always test the functionality before sharing the dashboard with others.
10. Troubleshooting and Optimization
As with any development process, you may run into issues. Here are some common troubleshooting steps:
- Performance: If your script is slow, consider reducing the amount of data being processed or optimizing your loops.
- Errors: Use
Logger.log()to debug and identify issues in your Apps Script code. - Permissions: Ensure that your Google Sheets file and Apps Script project have the appropriate permissions for users.
11. Final Thoughts: Moving Forward with Google Apps Script
Google Sheets, when paired with Google Apps Script, is a powerful platform for creating dynamic, interactive dashboards. Whether you are tracking sales, project progress, or any other type of data, you can use Apps Script to automate processes and make your dashboard as interactive as you need. By using the techniques and examples provided in this post, you should be well on your way to building fully interactive dashboards for your data analysis needs.
So, start experimenting with Google Apps Script today, and elevate your Google Sheets dashboard game!
Leave a Reply